Skip to content
10+% of SoCal Homes Don’t Have Insurance
10+% of SoCal Homes Don’t Have Insurance
Across all of California, the study found 806,600 owners without coverage out of 7.66 million residences.
That’s 10.5% of all homeowners.
Statewide, the share of uninsured runs above 19% in three counties – Lake, Kings, and Humboldt. Meanwhile, another trio is below 7%: Marin, El Dorado, and San Luis Obispo.
California home insurance premiums have risen 48% in the past five years. However, this isn’t just a California cost issue. Rates nationwide are up 38% in the same period.
Location. Location. Location.
Owners with less to lose seem willing to take the no-insurance bet. At the county level, uninsured homes tend to be concentrated in less-populated parts of the state.
The 14 counties with the highest uninsured rates have a combined 752k homes, 15% of which are not covered.
In the 14 counties where no insurance is the least common, 3.78 million homes lack coverage, and 9% lack coverage.
What’s financially at stake is also a factor, as shown by comparing these geographic extremes with November’s median home-sale prices from CAR.
The typical house price in low-coverage counties was $436,000, compared to $1.06 million in counties where Insurance was most common.
Postscript
Here are coverage details for the state’s other most-populated counties …
Orange: 10.5% uninsured – 65,200 of 622,600 homes.
San Diego: 9.8% uninsured – 62,900 of 643,300 homes.
Riverside: 10.4% uninsured – 57,100 of 547,300 homes.
San Bernardino: 11.2% uninsured – 47,900 of 428,500 homes.
Santa Clara: 9.6% uninsured – 34,700 of 360,200 homes.
Sacramento: 12.1% uninsured – 41,700 of 345,000 homes.
Alameda: 10.1% uninsured – 33,100 of 328,200 homes.
Contra Costa: 8.8% uninsured – 25,200 of 285,300 homes.
Share This Story, Choose Your Platform!
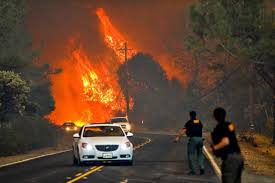 In Los Angeles County, struck recently by a series of devastating wildfires, 9.8% of homeowners were uninsured; by this math, 154k out of 1.57 million homes.